
Traycer turns what’s left into what’s next.
Food loss and waste drive 8–10% of global greenhouse gas emissions.
Traycer helps every kitchen see what comes back, count its footprint, and change what comes next.
Why it matters
- 1.05B
- tonnes of food wasted worldwide in 2022
- 28%
- of that waste came from food service
- 8–10%
- of global greenhouse gas emissions come from food loss and waste
2022 global estimates, including inedible parts. UNEP Food Waste Index, 2024

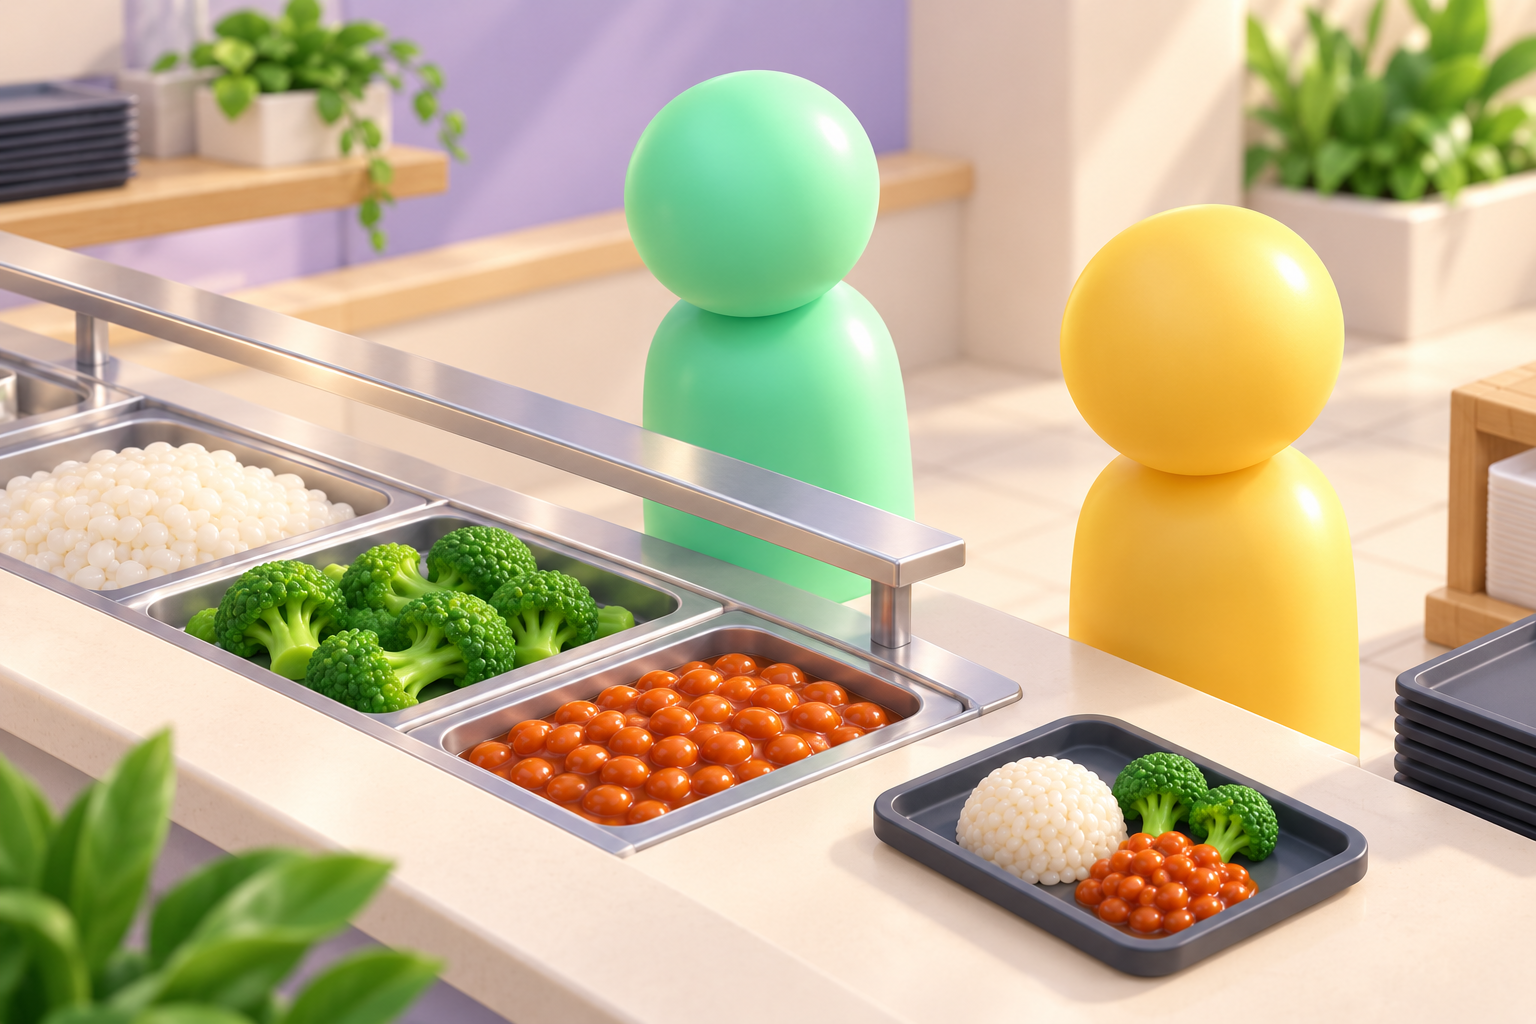
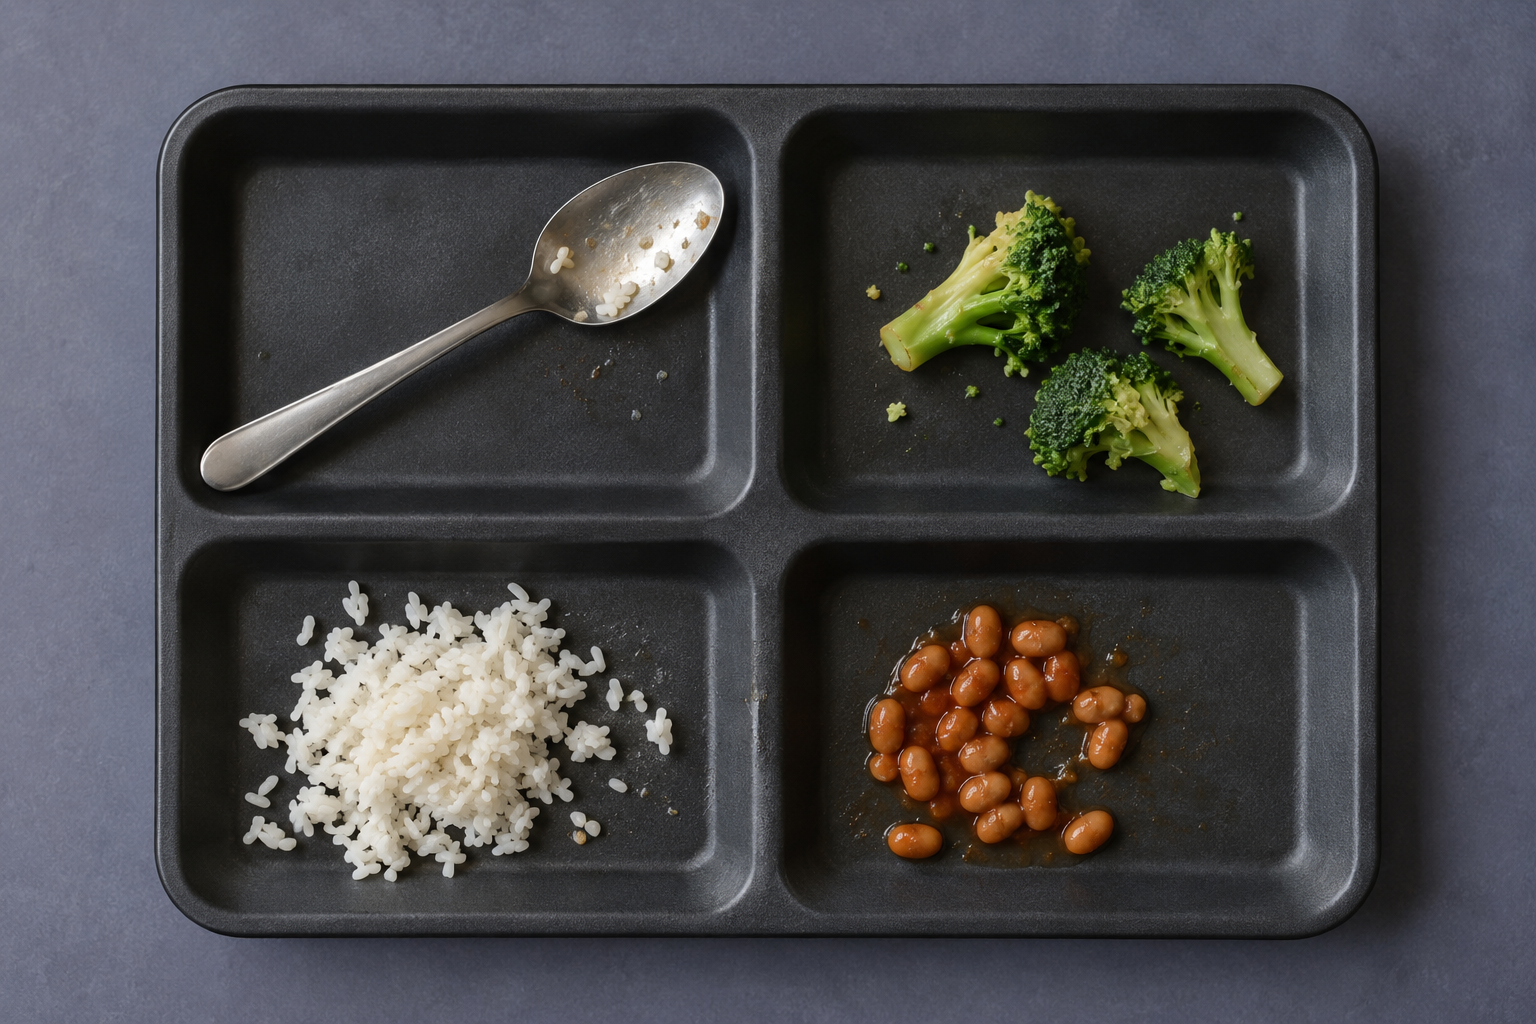
Every traytells a story.
When leftovers end up in one bin, it’s hard to see which foods are going uneaten.
Traycer uses camera images to identify leftover foods and estimate what remains on each tray, then turns every gram into its estimated carbon and water footprint. Review captures and compare waste by food in the dashboard.
One example service, estimated
- 33.5 kg CO2e
- ≈ 86 miles of driving
- 10,600 L water
- ≈ 140 showers
- 10.6 kg food
- ≈ 25 meals by weight
Footprint estimates use the dashboard’s published factors: Agribalyse 3.1, Poore and Nemecek 2018, and EPA WARM for CO2e. Water uses a 1,000 L per kg average from the Water Footprint Network.

A little lessleft behind.
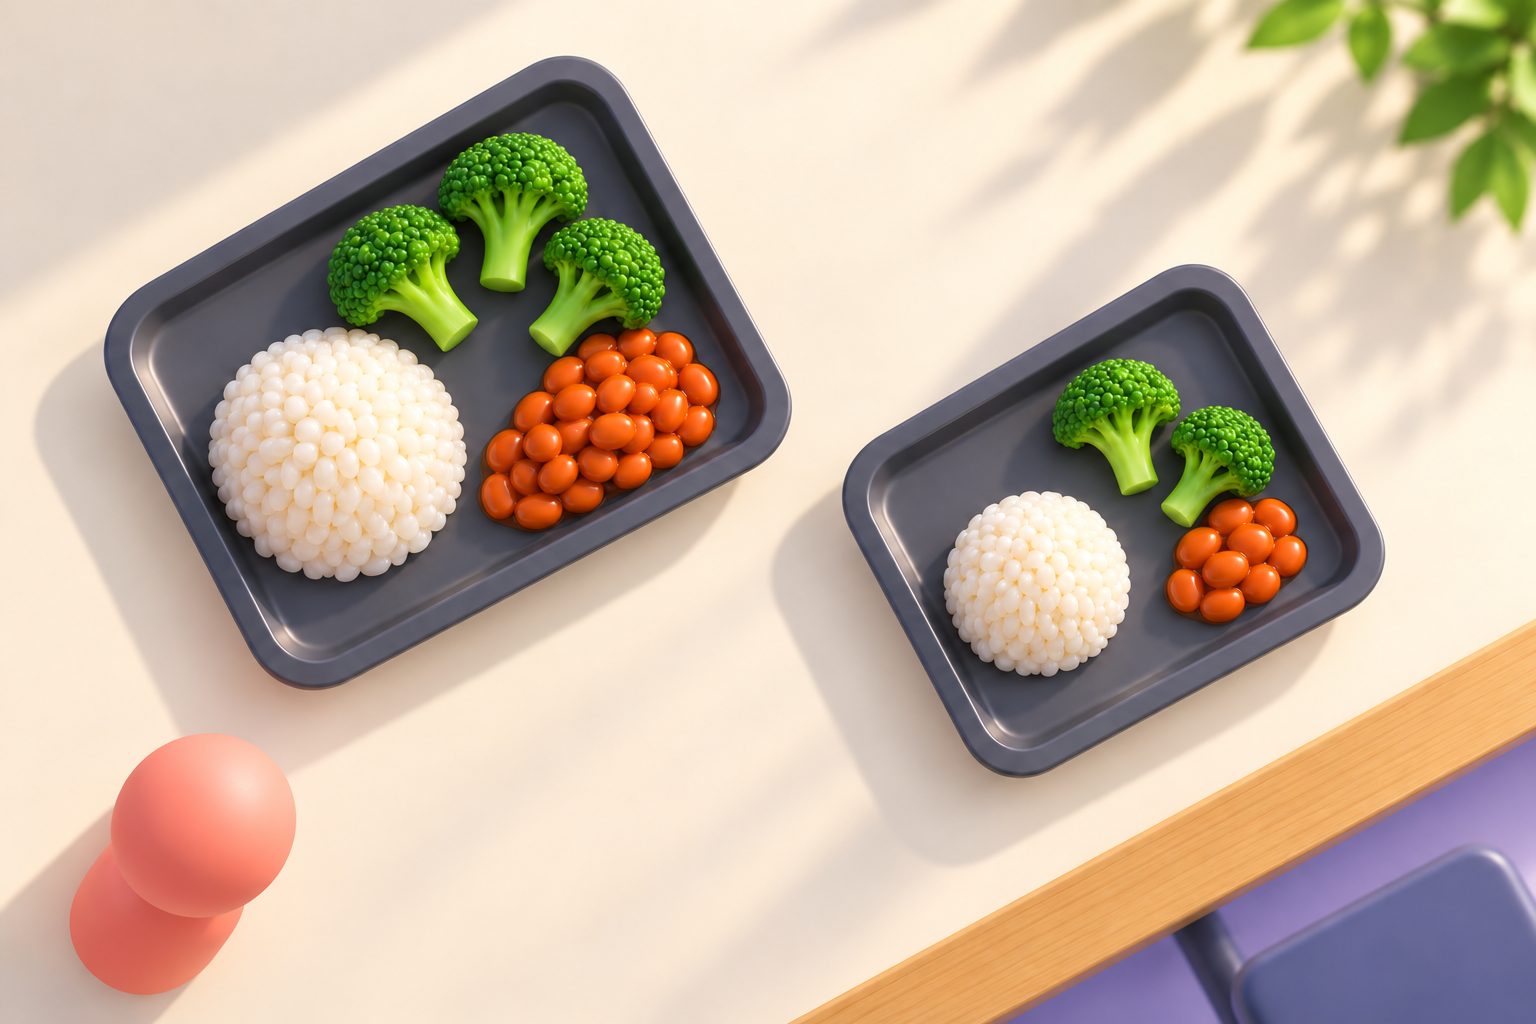
Portion sizes are hard to get right. Trying a new menu on a real service can mean discovering waste after the food is already served.
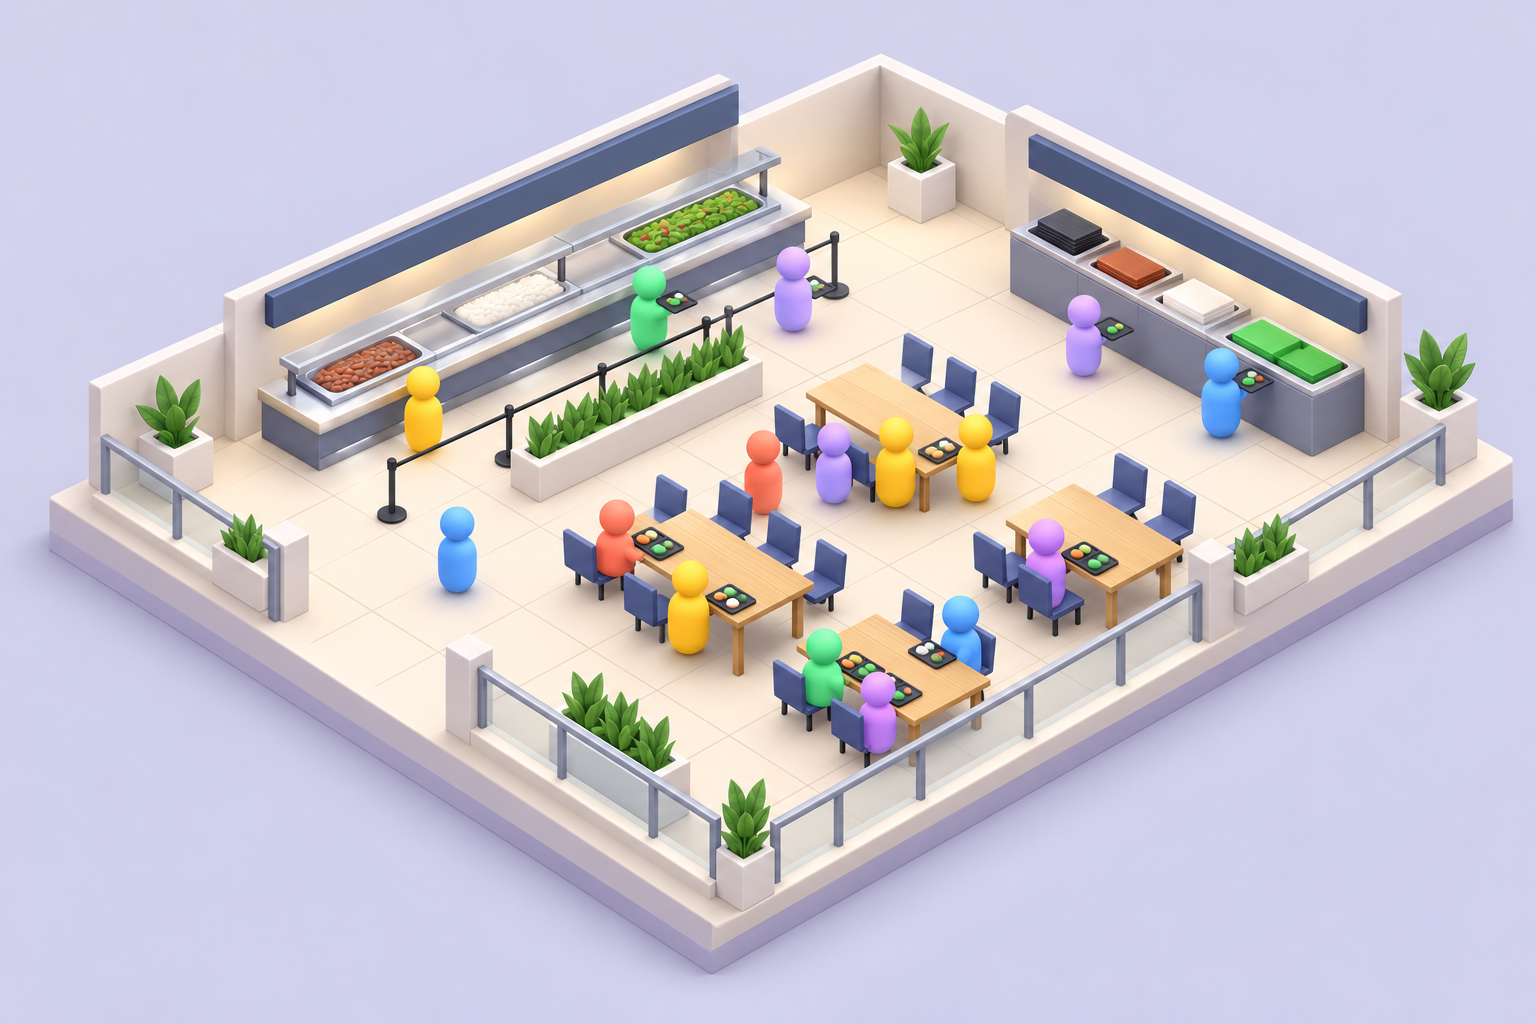
Traycer simulates diners choosing meals, eating, and returning trays. Compare menu and portion scenarios to explore how changes could affect leftovers before the next service.
Simulation ↗Example portions per tray
- Beans
- 150 → 150 g
- Rice
- 200 → 200 g
- Salad
- 120 → 120 g
Good food.
Less waste.
Lower emissions.
Make the next
meal better.
Every tray counted shows where carbon, water, and money can be saved.
Open Traycer ↗